
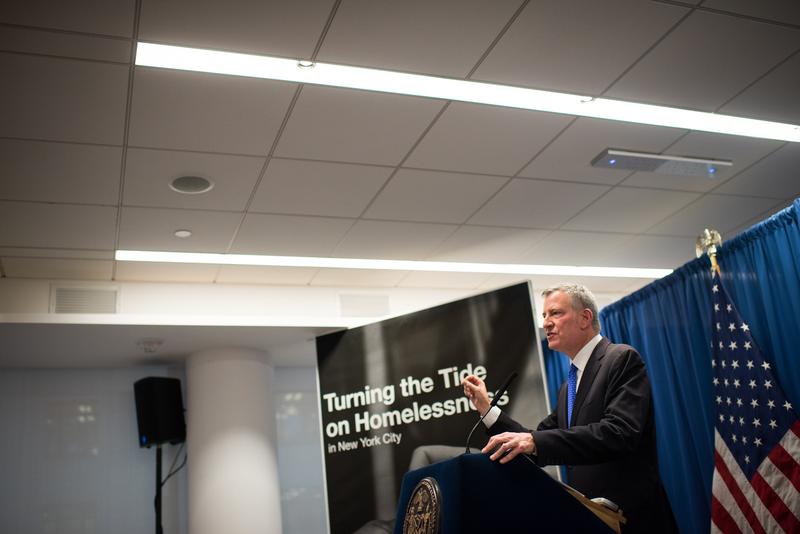
When Mayor Bill de Blasio announced his latest plan to address the homeless crisis last week, he said the shelter he’s opening in Crown Heights next month is a perfect example of what he’s trying to achieve.
“You’re going to see something you never saw before — 132 families, overwhelmingly from Crown Heights, Brooklyn,” he said. “Literally, the preference will be for people who come from that immediate neighborhood and immediately surrounding neighborhoods.”
The mayor’s latest plan to address the city’s homeless crisis is to build 90 new shelters over the next five years while shutting down the hotels and private apartments the city currently uses to house 18,000 homeless New Yorkers. His goals are to allow homeless New Yorkers to stay in the neighborhoods they’re coming from and make the distribution of shelters across the city more fair.
But on Rogers Avenue, where the first new shelter will open, many residents said the city shouldn’t bring more shelters here. Clover Taylor said she thought the shelter would “degrade the neighborhood a little bit.”
“They should maybe take it somewhere else, because it’s mostly residential areas around here,” she said. “Further down, places like Bushwick.”
This particular zip code in Crown Heights has one of the lowest shelter concentrations per resident in the city — just 17 apartments for homeless families, according to data obtained under the state Freedom of Information Law.
Another shelter, for 103 older men, will open this month in northern Crown Heights, another zip code with a smaller number of shelters. Robert Cornegy represents the area in the City Council. He says this is not a NIMBY (Not in My Backyard) community. But he says he already has 15 shelters in his council district, and he doesn’t want more.
“The first concern for residents there, in a rapidly gentrifying community, is the negative impact potentially it could have on their property values,” Cornegy said. “The other concerns range from the very obvious, the impact on essential services, such as water pressure, all the way to the fact that the shelter is supposed to provide 40 jobs and what will that mean to an already overburdened parking situation.”
De Blasio says the new shelters will replace hotels and private apartments, making it easier on communities that have a disproportionately large number of those types of housing.
But our analysis shows that it won’t work in the neighborhoods that have the largest share. The zip code with the highest concentration of homeless is in East Harlem, which has more than 1,200 units. That includes large shelters on Wards Island, mostly for single men, many of whom receive services in East Harlem.
“That is extremely frustrating to our community,” said Diane Collier, the chairwoman of Community Board 11, which covers that area. “That expands the community beyond the stretch of anybody's imagination.”
Map of Homeless Facilities in New York City
This map shows homeless housing per 10,000 residents by zip code in November 2016. Darker color indicates higher concentration of homeless housing. Homeless housing is available in traditional shelters, hotels, and cluster (private) apartments. Homeless facilities data is from a FOIL request to the NYC Department of Homeless Services. Population data is from the 2015 5-Year American Community Survey.
The next four zip codes with the highest concentration of shelters are in midtown east, home to the sprawling Bellevue Men’s Shelter; the central and south Bronx; and Jamaica, Queens. In all of those areas, except in Jamaica, the majority of the homeless live in standard shelters. And there are no plans, as Collier knows, to shut them down.
“We have taken on the burdens of other community and I think that's where it's going to be difficult,” she said.
Data Analysis Methodology
In our map, "units" represents the sum of beds and rooms available for homeless individuals and families. This is a proxy for, but an under-count of, capacity — some rooms house more than one individual. We await newer data that includes capacity figures.
WNYC intern Cathy Wong contributed to the data analysis and visualization for this story.