
If you had the misfortune of heading home from the Brooklyn Bridge-City Hall 4-5-6 platform Wednesday evening, you may have endured the hottest subway platform in the city. At 7:09 p.m., it was 106.6 degrees.
Also as hot as dog's breath was the World Trade Center station, which, like Brooklyn Bridge, is a place trains tend to sit for long periods of time – allowing hot air-conditioning exhaust from waiting trains to build up in the station.
We went to 103 platforms during the evening rush to take each one's temperature, all south of Central Park and mostly in Manhattan. The most pleasant platform was 5th Ave-59th St. on the N-Q-R, at 68 degrees. The median was 84.2 degrees, a tad cooler than the official air temperature of 89 degrees at 6 p.m., according to the National Weather Service.
Folks at the MTA say they're certainly aware of the sweaty situations, but that there's not a lot to be done in most stations because venting them would require MTA control over what's directly above the station – which often isn't the case. Grand Central runs cooler because the MTA does have control of the space above the subway, and officials have said the Second Avenue Subway will run about 10 degrees cooler than most.
Methodology
We picked the stations south of Central Park because that's where the majority of subway riders start their trip home after work. Then we mapped routes four people could take to hit every one of those stations (and ended up including a few Brooklyn and Queens stations in the process). We started at 5:30 p.m. and ended about two hours later.
At each stop, we stepped off the train, moved away from the doors to avoid the train's air conditioning, aimed a consumer-grade temperature sensor at the platform surface and took a reading. Our measurements are probably a few degrees cooler than what someone standing on the platform would feel on their face five or six feet above the floor.
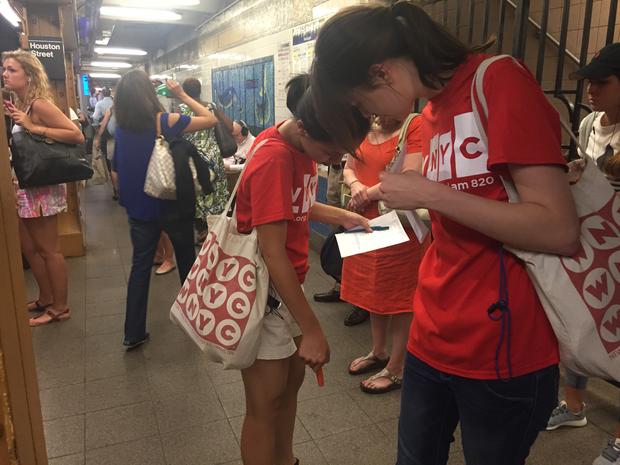
The thermometers we used list an accuracy of 2 degrees Celsius. That's about 3.6 degrees Fahrenheit. At several platforms we took more than one reading, and then took the median of those values as the final measure.
While errors are certainly possible, and even more readings would increase the accuracy, we think our method gives a reasonable sense of which platforms ran the hottest on one of the hottest days of the year.